最近figmaで簡単なグラフを作りたくてプラグインを探していたのですが、
そういえばプラグインってどうやって作れるんだろう?とふと思い調べてみたところ、
プラグイン自体は比較的手軽に作れるようだったので試してみることにしました!
figmaプラグインとは
Plugins are programs or applications created by the Community that extend the functionality of Figma's editors. Plugins run in files and perform one or more actions. Users and organizations take advantage of plugins to customize their experience and create more efficient workflows. Introduction | Plugin API
figmaドキュメントによると、プラグインとは、コミュニティによって作成されたfigmaの編集機能と拡張するアプリケーションです。
コミュニティとはユーザーがプラグインやデザインなどを共有したりできるプラットフォームです。
作成したプラグインはコミュニティで公開すれば誰でも使えるようになります(有料のものもあります)
始め方
figmaで新しいデザインファイルを作成します。
作成したまっさら状態の画面で、
右クリックで plugins > development > New plugin
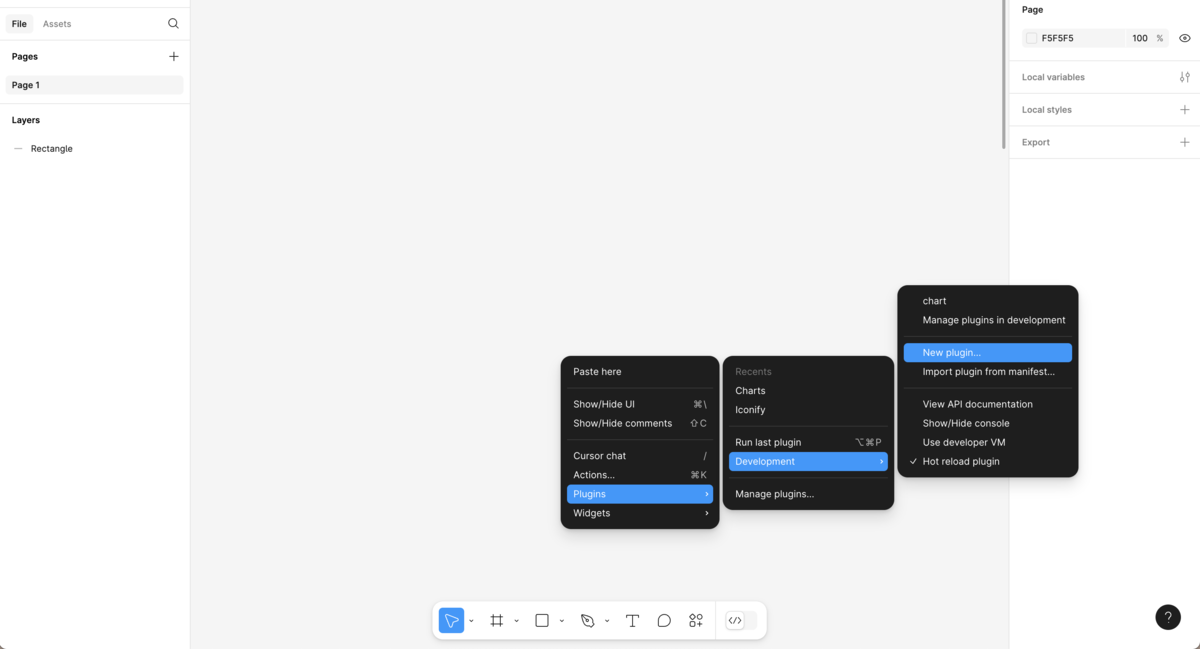
Figma designを選択します。
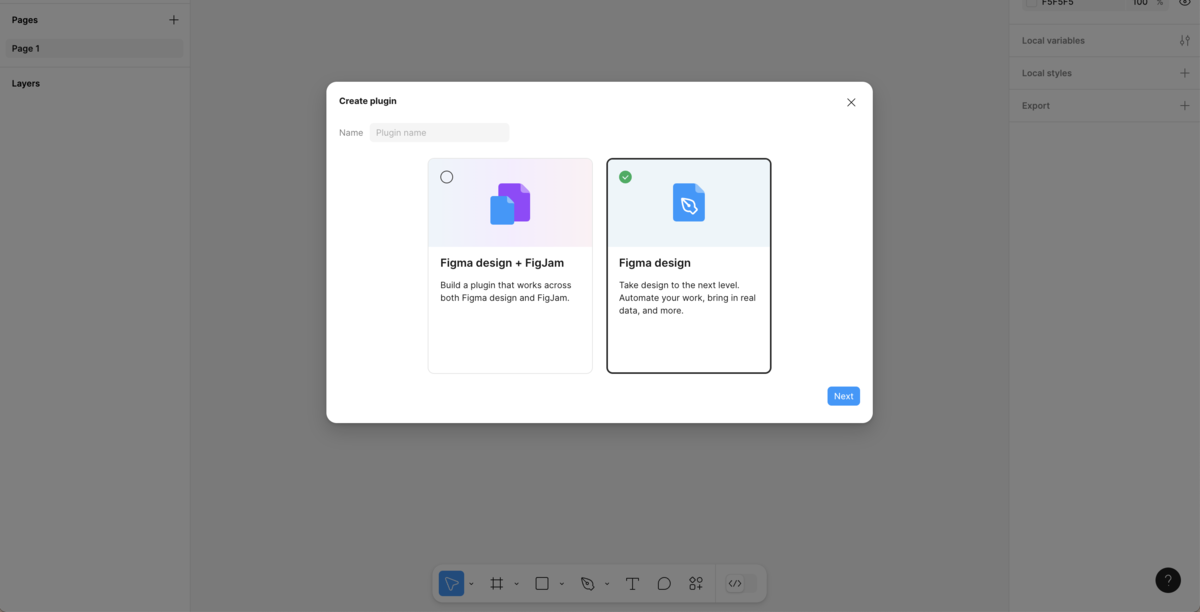
Custom UIを選択します。

保存すると以下のファイルが作成されます。
code.js // プラグインの中身
code.ts  // code.jsTypeScriptファイル
manifest.json
package-lock.json
package.json
README.md
ts.config.json
ui.html // プラグインのUI
ファイルが作成されたらnpm installで必要なパッケージをインストールします。
これで一通りの準備は完了です。
早速プラグインを作り始めましょう!
インストールの時点ではサンプルプラグインが作成されています。
サンプルは「Rectangle Creator」、入力した数値の数の四角形を作成するプラグインのようです。


code.ts
// This plugin will open a window to prompt the user to enter a number, and
// it will then create that many rectangles on the screen.

// This file holds the main code for plugins. Code in this file has access to
// the *figma document* via the figma global object.
// You can access browser APIs in the <script> tag inside "ui.html" which has a
// full browser environment (See https://www.figma.com/plugin-docs/how-plugins-run).

// This shows the HTML page in "ui.html".
figma.showUI(__html__);

// Calls to "parent.postMessage" from within the HTML page will trigger this
// callback. The callback will be passed the "pluginMessage" property of the
// posted message.
figma.ui.onmessage = (msg: { type: string; count: number }) => {
  // One way of distinguishing between different types of messages sent from
  // your HTML page is to use an object with a "type" property like this.
  if (msg.type === "create-shapes") {
    // This plugin creates rectangles on the screen.
    const numberOfRectangles = msg.count;

    const nodes: SceneNode[] = [];
    for (let i = 0; i < numberOfRectangles; i++) {
      const rect = figma.createRectangle();
      rect.x = i * 150;
      rect.fills = [{ type: "SOLID", color: { r: 1, g: 0.5, b: 0 } }];
      figma.currentPage.appendChild(rect);
      nodes.push(rect);
    }
    figma.currentPage.selection = nodes;
    figma.viewport.scrollAndZoomIntoView(nodes);
  }

  // Make sure to close the plugin when you're done. Otherwise the plugin will
  // keep running, which shows the cancel button at the bottom of the screen.
  figma.closePlugin();
};
ui.html
<h2>Rectangle Creator</h2>
<p>Count: <input id="count" type="number" value="5"></p>
<button id="create">Create</button>
<button id="cancel">Cancel</button>
<script>

document.getElementById('create').onclick = () => {
  const textbox = document.getElementById('count');
  const count = parseInt(textbox.value, 10);
  parent.postMessage({ pluginMessage: { type: 'create-shapes', count } }, '*')
}

document.getElementById('cancel').onclick = () => {
  parent.postMessage({ pluginMessage: { type: 'cancel' } }, '*')
}

</script>
ファイルを見てみると、figma.showUIや、figma.ui.onMessage、figma.createRectangleなどPluginAPIを利用した記述が見られます。
APIを利用することで、figmaファイルにアクセスしたり、値を受け取ったり、描画したりできます。
PluginAPIについては実際に作成しながら見ていこうと思います。
【補足】プラグインのhot reload
hot reloadの設定をしていないと、ファイルを修正するたびにプラグインを起動し直さないといけません。
右クリックでPlugins > Development > hot reload pluginにチェックがついているか確認します。
チェックがついていなければクリックすればhot reloadがONの状態になります。

プラグインを作っていく
figmaプラグインの仕組みはこちらにあります。 私のざっくり理解だと、figma上にプラグインのUIをiframeで作成、プラグイン側にはpostMessageによるメッセージ送信によって通信を可能としているようです。 iframeなので、ブラウザAPIや外部のAPI系も使用できます。(manifest.jsonのnetworkAccessにアクセスしたいドメインの追加が必要です) Chrome拡張機能を扱ったことがあれば比較的理解しやすい仕組みに思いました!(iimonプロダクトにもChrome拡張機能があります)
UI作成
今回は簡単な棒グラフを作成します。
四角形を作成するサンプルプラグインがありましたが、 棒グラフはその応用です。
UI上で入力する値
- グラフ全体の最大縦幅
- グラフ全体の横幅
- データセット(棒グラフに設定する絶対値)
縦幅とデータセットの値を元にして棒グラフごとの高さを設定します。
ui.html
<h2>Bar Chart Creator</h2>
<p>サイズ(横)<input id="width" type="number" value="100"></p>
<p>サイズ(縦)<input id="height" type="number" value="100"></p>
<p>グラフデータ入力<input id="data" placeholder="カンマ区切りで入力 例:10, 10, 50"></p>
<button id="create">作成</button>
<button id="cancel">キャンセル</button>
<script>

document.getElementById('create').onclick = () => {
  const width = parseInt(document.getElementById('width').value, 10);
  const height = parseInt(document.getElementById('height').value, 10);
  const data = document.getElementById('data').value;
  parent.postMessage({ pluginMessage: {type: 'create-bar-chart', width, height, data} }, '*')
}

document.getElementById('cancel').onclick = () => {
  parent.postMessage({ pluginMessage: { type: 'cancel' } }, '*')
}

</script>
データセットにはカンマ区切りで数字を入力します。 (本来であればバリデーションも用意してあげるべきですね)
プラグイン作成
code.ts
figma.showUI(__html__);

figma.ui.onmessage = (msg: {
  type: string;
  width: number;
  height: number;
  data: string;
}) => {
  if (msg.type === "create-bar-chart") {
    const { data, width, height } = msg;
    const nodes: SceneNode[] = [];
    const dataSet = data.split(",").map((d) => parseInt(d));
    // 棒グラフの幅を計算
    const barWidth = width / dataSet.length;

    for (let i = 0; i < dataSet.length; i++) {
      const rect = figma.createRectangle();
      // heightの100%に対しての割合を計算
      const barHeight = (height / 100) * dataSet[i];
      rect.x = i * barWidth;
      rect.y = height - barHeight;
      rect.resize(barWidth, barHeight);
      const color = figma.util.rgb("#0098C2");
      console.log(color);
      rect.fills = [{ type: "SOLID", color }];
      figma.currentPage.appendChild(rect);
      nodes.push(rect);
    }

    figma.currentPage.selection = nodes;
    figma.viewport.scrollAndZoomIntoView(nodes);
  }

    // 描画完了したらプラグインを閉じる
  figma.closePlugin();
};
一番最初にある figma.showUI(html) を実行することでui.htmlの内容をfigma上に表示することができます。 先ほど述べたiframeがここで作成されます。
figma.ui.onmessageでUI側からのpostMessageの内容を受け取ることができます。
figma.createRectangleで棒グラフ単体の四角形を作成し、そのサイズと色を設定しています。
結果

割と想像していた感じでグラフが作れました!
ちなみにこのグラフはiimonの創業からの社員数を表したものです。
最後に
とりあえず試したくて見た目やラベリング表示など度外視なのですが、 思ったよりは自由度もありそうなのでもう少し整えてみようかと思います。
最後になりますが、現在弊社ではエンジニアを募集しています。 この記事を読んで少しでも興味を持ってくださった方は、ぜひカジュアル面談でお話ししましょう!
iimon採用サイト/ Wantedly / Green